For clinicians
Doctor Portal
Access cardiac rhythm research workspaces for reviewing patient-shared records, longitudinal trends, and analysis results.
Open Doctor PortalCardiac rhythm analytics by CardiaForge
CardiaForge supports research into cardiac rhythm patterns using RR intervals, wavelet analysis, and longitudinal comparison across controlled study environments.
The platform is built for exploratory analysis, patient-clinician collaboration, and reproducible cardiac data review.
Access is limited to authorized users and participating organizations.
Research-first cardiac rhythm analysis with a clear boundary from diagnosis or treatment decisions.
Dedicated access paths for clinicians and participants working with the CardiaForge research platform.
Designed for secure, organization-aware deployments where cardiac data remains under controlled access.

Platform focus
Rhythm research
CardiaForge helps researchers explore rhythm variability, wavelet-derived features, and changes across time.
Access
Separate portal experiences support the needs of care teams, researchers, and study participants.
Entry points
CardiaForge provides separate entry points for clinicians and participants, with access governed by the organization or study context.
For clinicians
Access cardiac rhythm research workspaces for reviewing patient-shared records, longitudinal trends, and analysis results.
Open Doctor PortalFor participants
Manage research participation, upload supported cardiac data, and review exploratory rhythm-analysis results.
Open Patient PortalResearch framing
CardiaForge is a research platform first. The work centers on transparent, repeatable analysis of RR intervals and wavelet-derived cardiac features.
CardiaForge focuses on RR intervals as the compact signal foundation for scalable HRV and wavelet research.
DWT, CWT, WPT, SWT, and related outputs expose time-frequency structure that simple averages miss.
Exploratory outputs are presented with a clear boundary from clinical diagnosis or treatment decisions.
Signal imagery
Every analysis produces a continuous wavelet scalogram alongside HRV metrics and the underlying RR-interval signal — the same result surface clinicians and researchers review inside the portals.
MIT-BIH 101
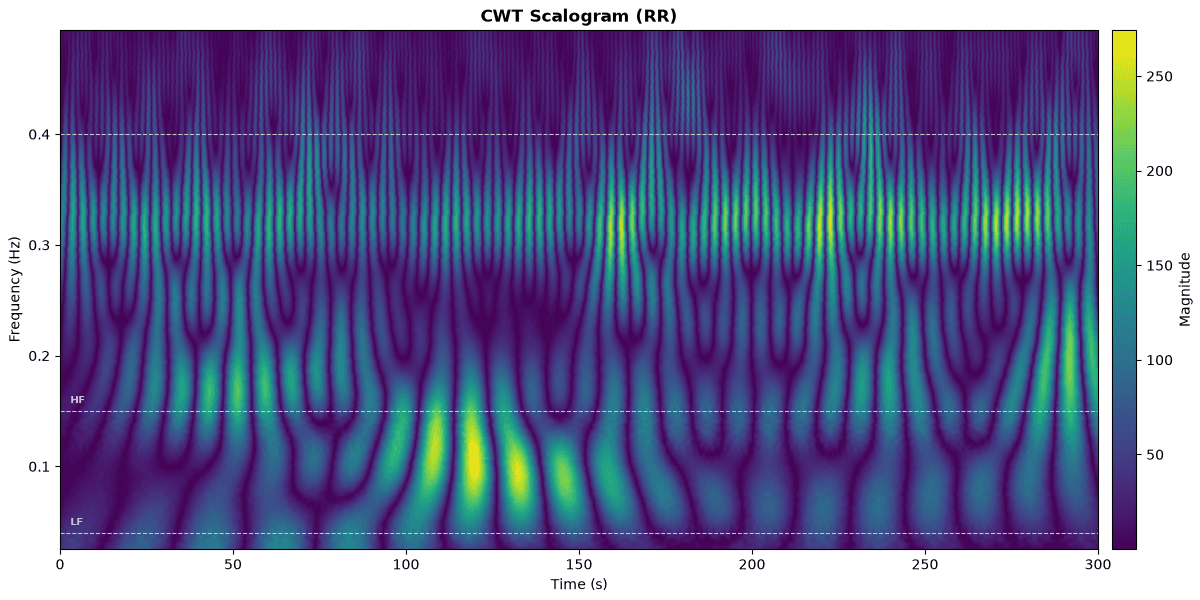
Mean HR 68.3 bpm
MIT-BIH 102
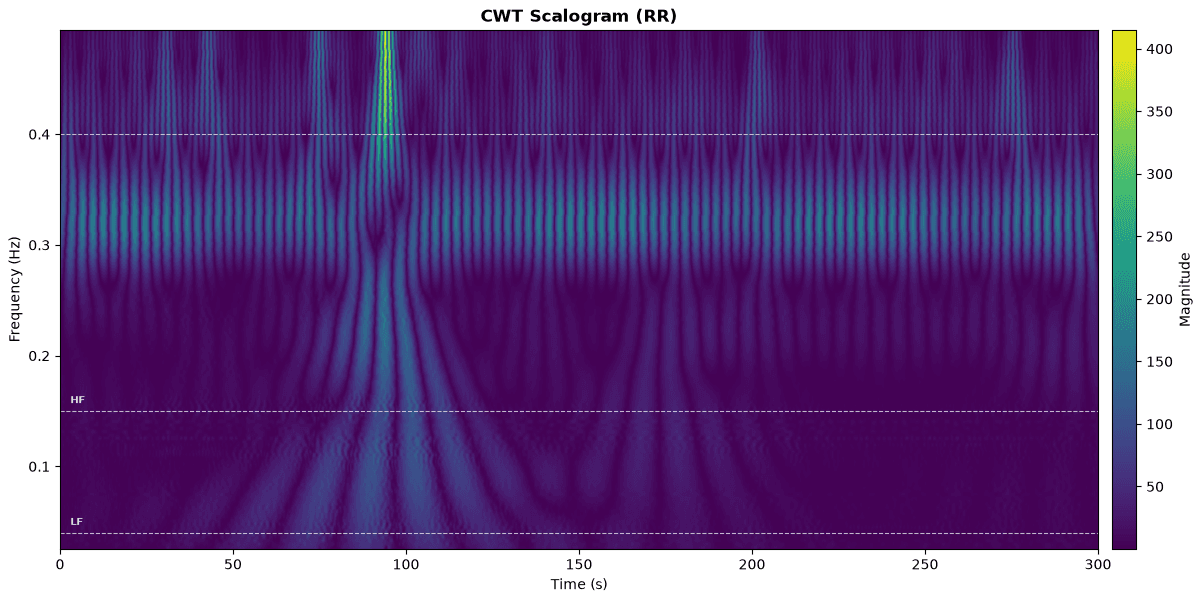
Mean HR 73.2 bpm
MIT-BIH 16272
Normal Sinus Rhythm
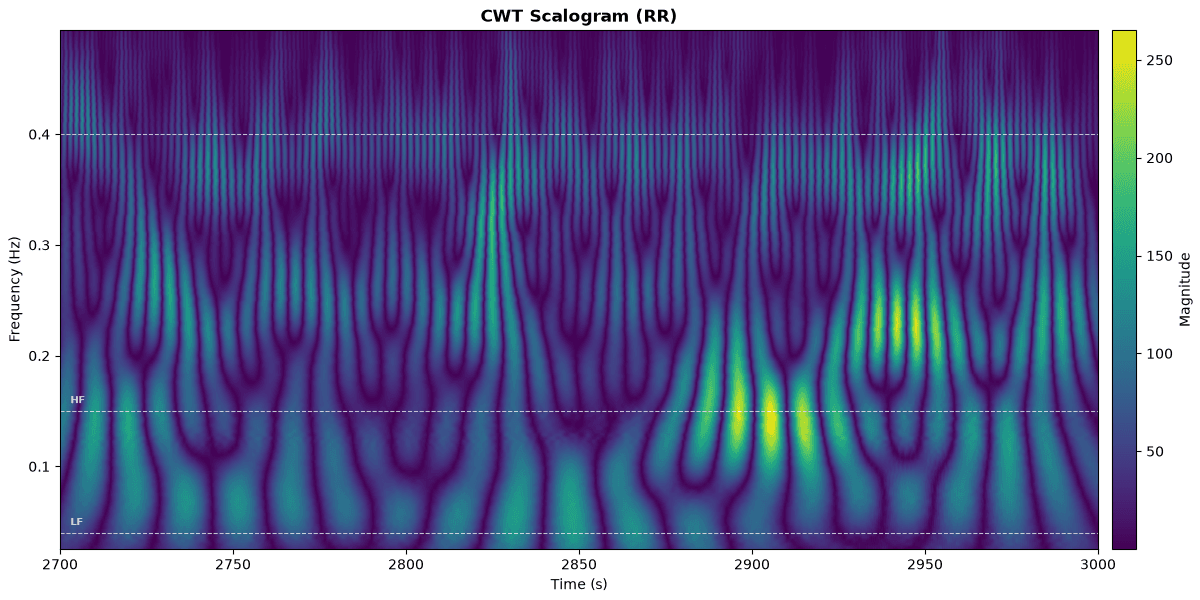
Mean HR 56.6 bpm
SDDB 35
Atrial fibrillation
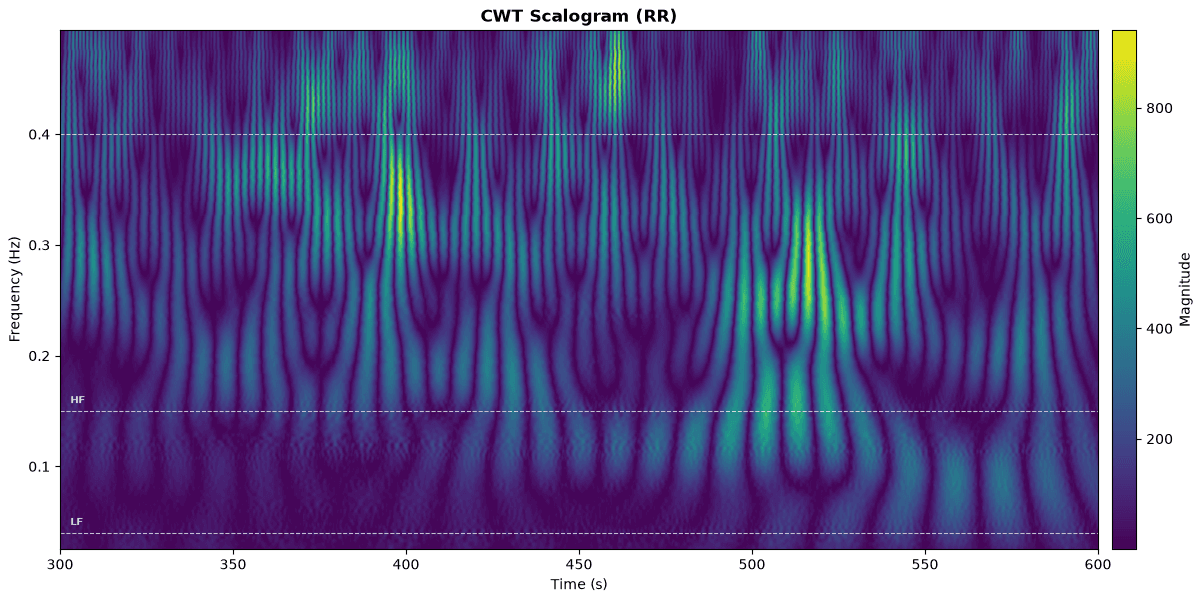
Mean HR 76.7 bpm
MIT-BIH 101
· first 300 s
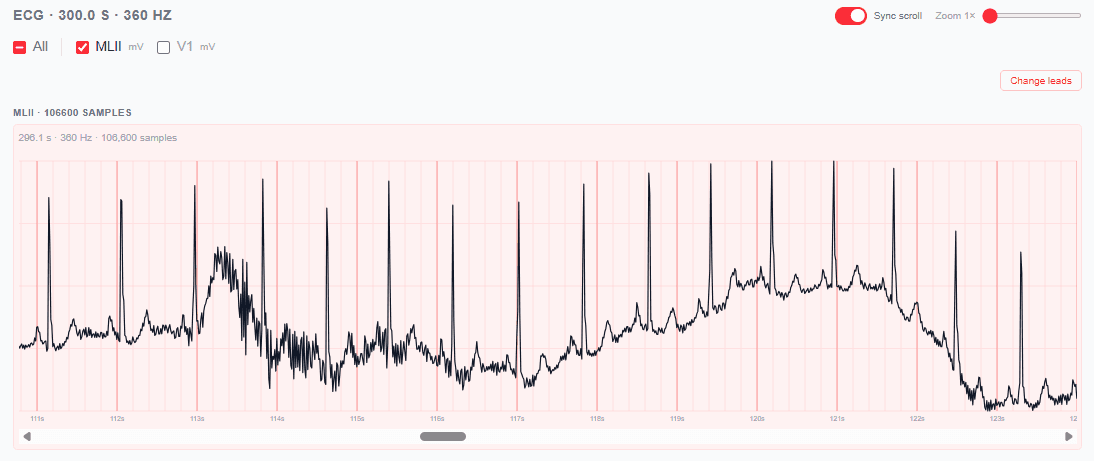
Example output computed by CardiaForge from MIT-BIH Arrhythmia Database, record 101, first 300 s. Continuous wavelet transform (Morlet). Research use only.
MIT-BIH 102
· first 300 s
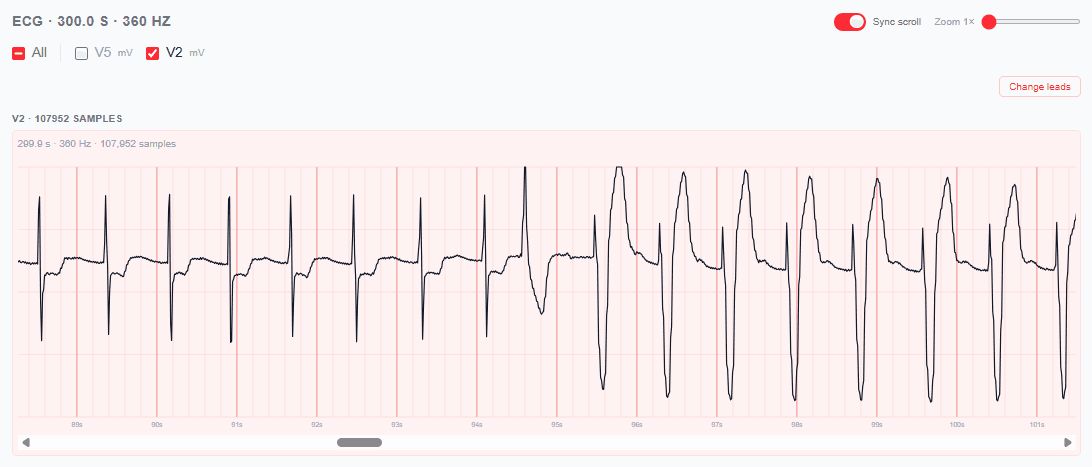
Example output computed by CardiaForge from MIT-BIH Arrhythmia Database, record 100, first 300 s. Continuous wavelet transform (Morlet). Research use only.
MIT-BIH 16272
Normal Sinus Rhythm · 45-50 minutes or recording
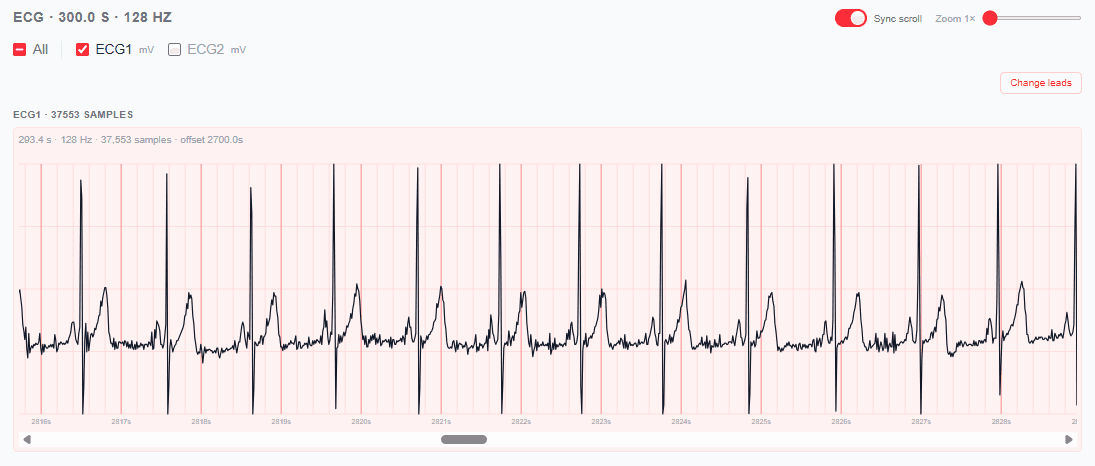
Example output computed by CardiaForge from MIT-BIH Normal Sinus Rhythm, record 16272, 45-50 minutes or recording. Continuous wavelet transform (Morlet). Research use only.
SDDB 35
Atrial fibrillation · 5-10 minutes recording
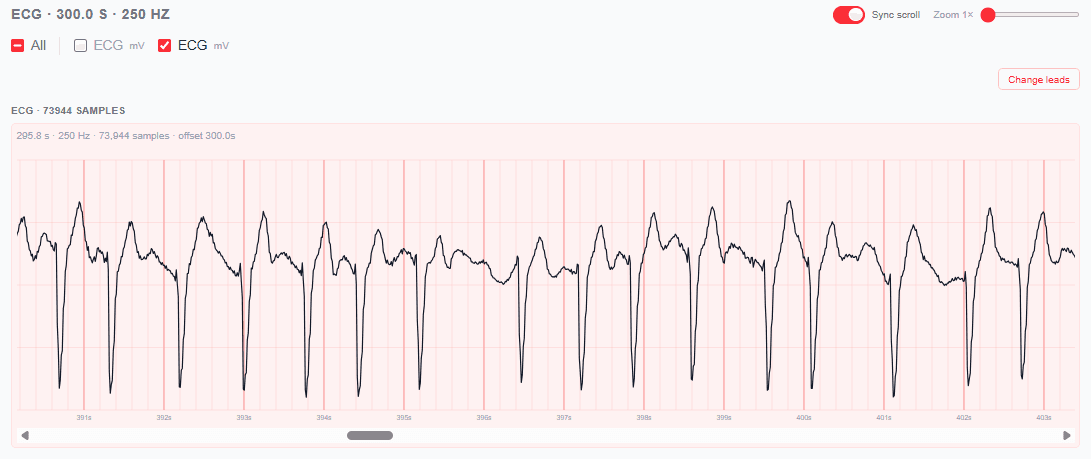
Example output computed by CardiaForge from Sudden Cardiac Death Holter Database, record 35, 5-10 minutes recording. Continuous wavelet transform (Morlet). Research use only.
Contact
CardiaForge focuses on research infrastructure for RR-interval analytics, wavelet-based feature extraction, and cardiac rhythm exploration.